Our work on suicide identification and prevention is reported on UConn Today:
UConn Researchers Leveraging CT Health Data to Develop Suicide Risk Algorithms
Our work on suicide identification and prevention is reported on UConn Today:
UConn Researchers Leveraging CT Health Data to Develop Suicide Risk Algorithms
GA and Post-doc positions are available in Chen’s research group. If interested please contact Chen at kun.chen@uconn.edu.
Our project on developing suicide risk algorithms for diverse clinical settings using data fusion (R01-MH124740) is awarded by NIH. This is a four-year multi-PI R01 grant starting from September 2020, led by Dr. Robert Aseltine from UCHC, Dr. Kun Chen from UConn, and Dr. Fei Wang from Cornell Medicine. We propose to use data from a large multistate health information exchange, integrated with hospital data from the State of Connecticut, to develop and test suicide risk algorithms using principles associated with statistical data fusion and transfer learning.
Please inquire Dr. Kun Chen at kun.chen@uconn.edu for possible Post-Doc and graduate assistantship opportunities.
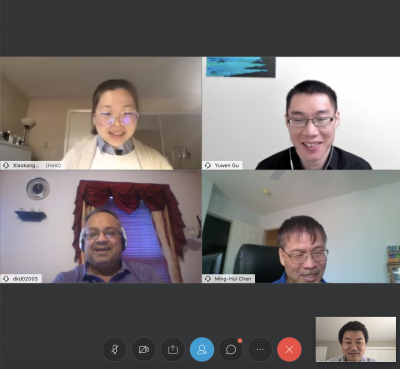
On April 6, Ph.D. student Xiaokang Liu successfully defended her thesis entitled “Integrative Multivariate Learning via Composite Low-Rank Decompositions”. The defense took place online via WebEx and was attended by more than twenty students and faculty members. Xiaokang’s committee consists of Drs. Kun Chen, Ming-Hui Chen, Dipak Dey, and Yuwen Gu. Thank you all for your support.
Xiaokang will join UPenn Biostatistics as a Post-Doc in July.
Congratulations, Dr. Liu!

Ph.D. student Zhe Sun won the 2020 ENAR Distinguished Student Paper Award and the most prestigious John van Ryzin Award for Best Paper! The awards recognize her paper entitled “Sparse Log-Contrast Regression with Functional Compositional Predictors: Linking Gut Microbiome Trajectory in Early Postnatal Period to Neurobehavioral Development of Preterm Infants”, co-authored by Zhe Sun, Wanli Xu, Xiaomei Cong, Gen Li, and Kun Chen.
Congratulations, Zhe!
Ph.D. student Yan Li won the 2020 ENAR Distinguished Student Paper Award! He is co-advised by Dr. Kun Chen and Dr. Jun Yan. The award recognizes his paper entitled “Pursuing Sources of Heterogeneity in Mixture Regression”, co-authored by Yan Li, Chun Yu, Yize Zhao, Robert Aseltine, Weixin Yao, and Kun Chen.
Congratulations, Yan!
The Interdisciplinary CLAS pilot grant program has decided to fund our proposal “Understanding Community‐ and Individual-Level Factors underlying Firearm Violence in America: Focus on the State of Connecticut.” This interdisciplinary project is led by Dr. Mary Bernstein from Sociology, Dr. Blair Johnson from Psychological Sciences, and Dr. Kun Chen from Statistics.
The last 10-15 years have seen the great emergence of drug development efforts in the rare disease space. Contributing factors include increased public awareness, encouraging drug regulation changes, scientific advancement in cellular/molecular biology and genetics, development of innovative trial designs, large influx of capital investment, availability of scientific talent through decades of cultivation, etc.
As a result, a great number of regulators, academicians, and industry statisticians now work to bring these orphan drugs to patients, facing unique technical issues and challenges. However, at least in the US, there is no statistical conference dedicated to such unique issues and challenges. Given the large unmet need, the New England Statistical Society (NESS) proposes this unique conference so that statisticians across the entire rare disease drug development spectrum have a common “home” to exchange ideas and share experiences, and also to network.
NERDS Workshop aims to be a one-day workshop with detailed presentations and discussions. Speakers from industry, academia, and government are invited. Topics will cover technical issues, regulation interpretation, industry trends, and case studies of both success and failure stories.
Promotional flyer in PDF.
UCSAS (http://uconnsportsanalytics.org) is to be hosted by UConn on Saturday, Oct. 5, 2019. It is the first sports analytics conference that is initiated by students and focuses on students.
Call For Poster Presentations
Have an interesting sports analytics project to present? We welcome poster presentations from both students and non-students.
About UCSAS
While there are many well-established sports analytics conferences, such as New England Symposium on Sports in Statistics (NESSIS) or the MIT Sloan Sports Analytics Conference, they are often not accessible to students due to technical level, cost, or space limitations. UConn, recognized nationally for its teams in sports such as basketball, baseball, and hockey, among others, will host the UConn Sports Analytics Symposium (UCSAS), which will focus specifically on undergraduate and graduate students who are interested in sports analytics. UCSAS, organized by the Statistical Data Science Lab at UConn and co-sponsored by the UConn Data Science Club (a student organization), aims to: 1) showcase sports analytics to students at an accessible level; 2) train students in data analytics with application to sports data; and 3) foster collaboration between academic programs and the sports industry.
Three Keynote Presentations
+ Dr. Gregory J. Matthews, Assistant Professor, Loyola University Chicago: How Often Does the Best Team Win? A Unified Approach to Understanding Randomness in North American Sport
+ Dr. Meredith J. Wills, Sports Data Product Specialist, SMT (SportsMEDIA Technology Corp): How to Catch a Fly(ball) with Chopsticks?
+ Dr. Brian Macdonald, Director of Data Analytics, ESPN: An Overview of Data Science Problems in the Sports Industry
Five Training Workshops:
Five parallel, 2-hour training workshops led by experienced graduate students from the Department of Statistics at UConn offer training from jumpstart to advanced sports analytic skills.
• (Introductory level) Introduction to R: Tuhin Sheikh
• (Introductory level) Introduction to Python: Jun Jin
• (Intermediate level) Data Visualization with R: Yiming Zhang
• (Intermediate level) Baseball Analytics with R: Zhe Wang
• (Advanced level) Web Scraping for Sports Data: Wanwan Xu
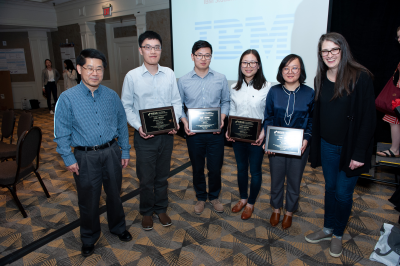
PhD students Yan Li and Xiaokang Liu won 2019 IBM Student Paper Awards from New England Statistics Symposium (https://nestat.org/ibmawards/ibm2019/).
Yan’s work is on “Weight Matrix Construction in Fingerprinting to Improve Detection of Global Temperature Signals in Historical Climate”. The paper is coauthored by Yan Li, Kun Chen, Jun Yan and Zhang.
Xiaokang Liu’s work is entitled “Multivariate Functional Regression via Nested Reduced-Rank Regularization”. The paper is coauthored by Xiaokang Liu, Shujie Ma and Kun Chen.
